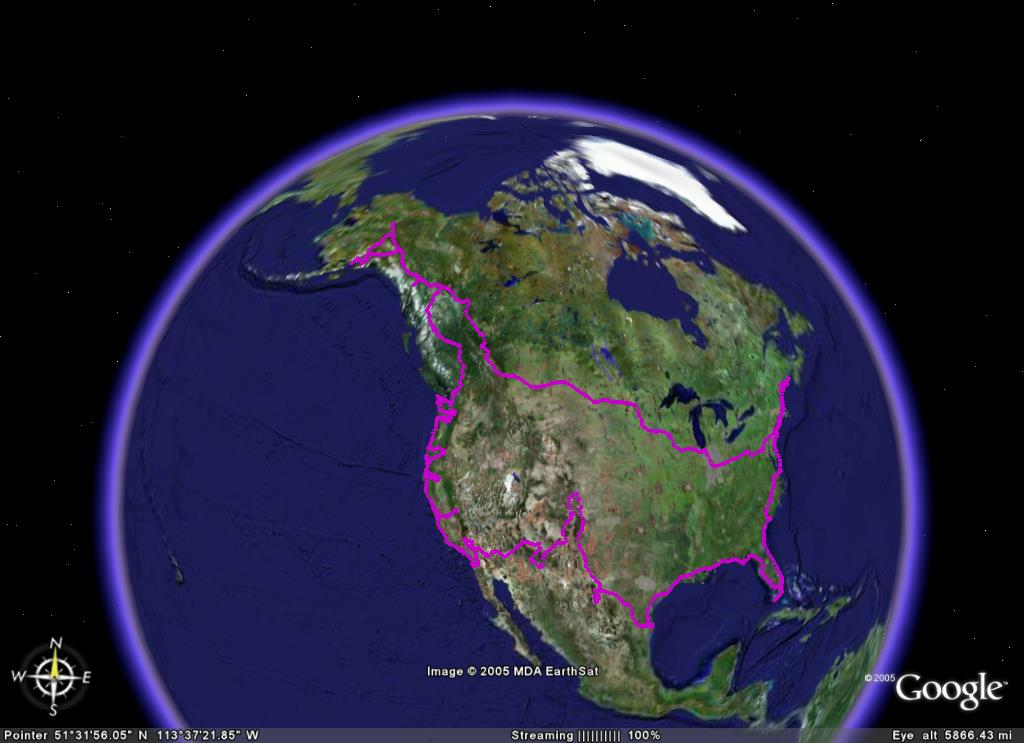
 Click image for a larger size
|
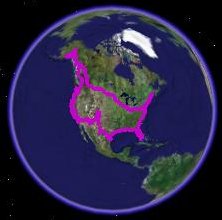
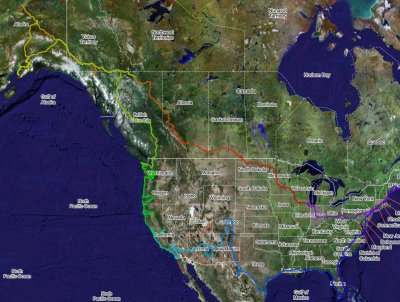
Google
Earth
Perhaps
the nicest, most interesting map format to use. With an
active Internet connection, the program running, and the data file
loaded you can fly around the globe - zooming in and out as you wish.
If you've never tried it - give it a whirl - good fun.
It does requrire the Google Earth program to be installed onto your
system (Google Earth site). If you wish to get a taste for what it
offers but don't wish to install anything - look below for the Google
Maps item. |
|
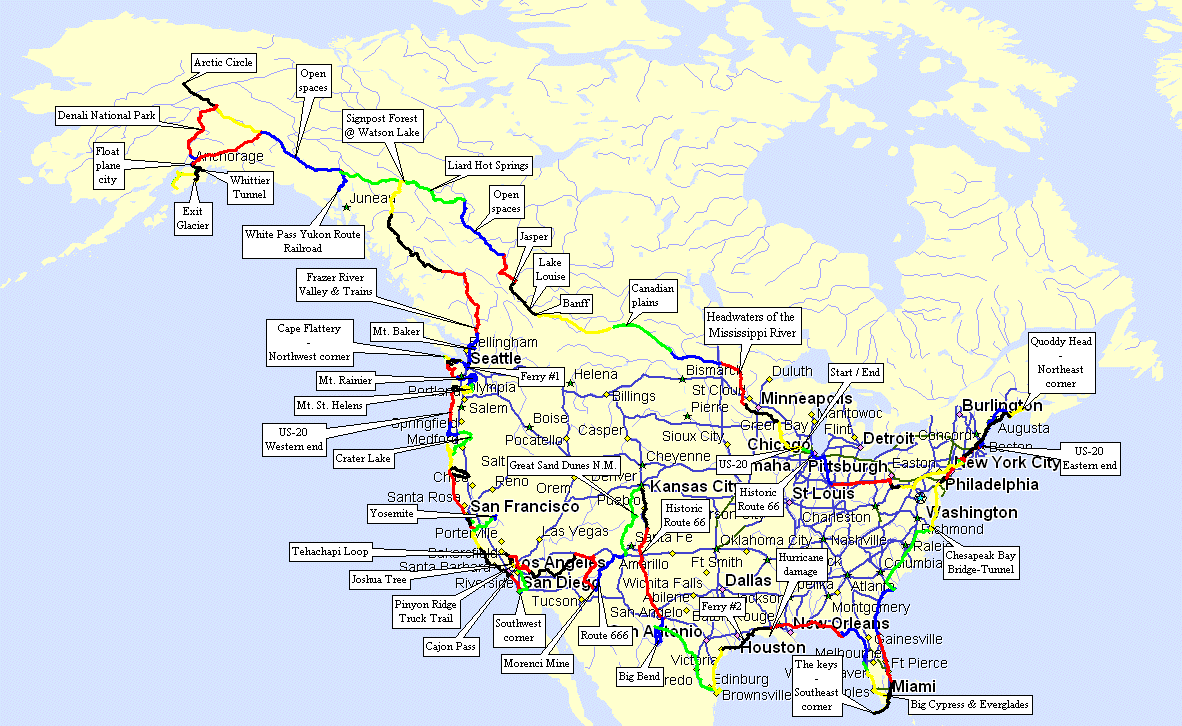
click image for a larger size
|
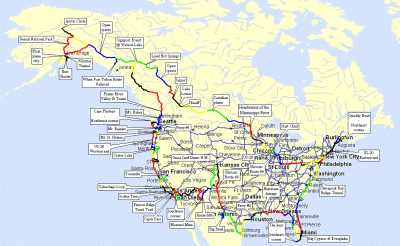
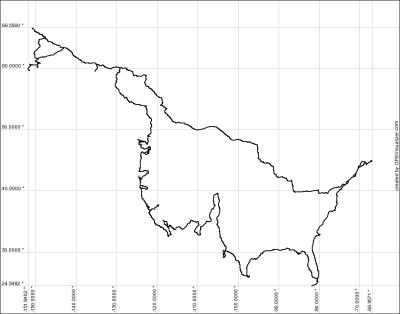
Street Atlas
The SA v7 data file allows you to readily zoom in/out along the route.
The route is multi-colored with each color representing one day of
riding. Additional notes for some of the major sights.
You will need a program on your system capable to open this data file.
If you have a current SA version, look below for a raw data file to
import as a track.
|
|
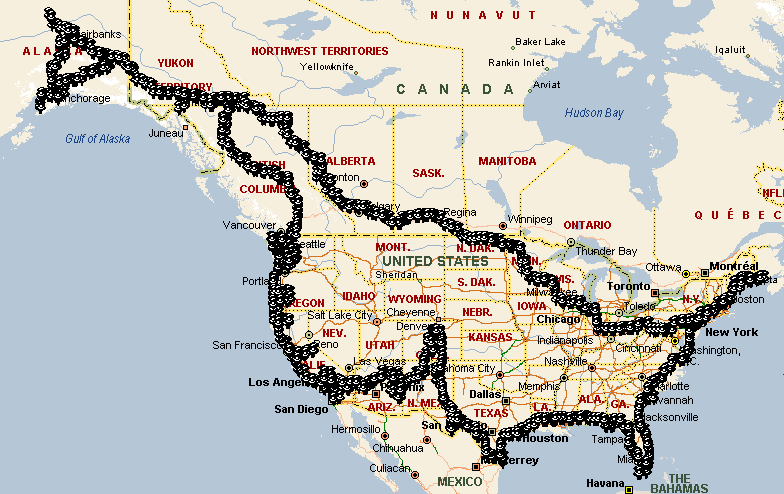
click image for a larger size
|
Unzipped, the resulting file is 13 MB. The data is a set of
"push
pins" depicting the route traveled. No notes added. Due to the quantity
of track log points imported (the full set) it does not correctly
represent the track in all zoom levels (at least for me) - though is
certainly good enough to work with. |
|
click image for a larger size
|
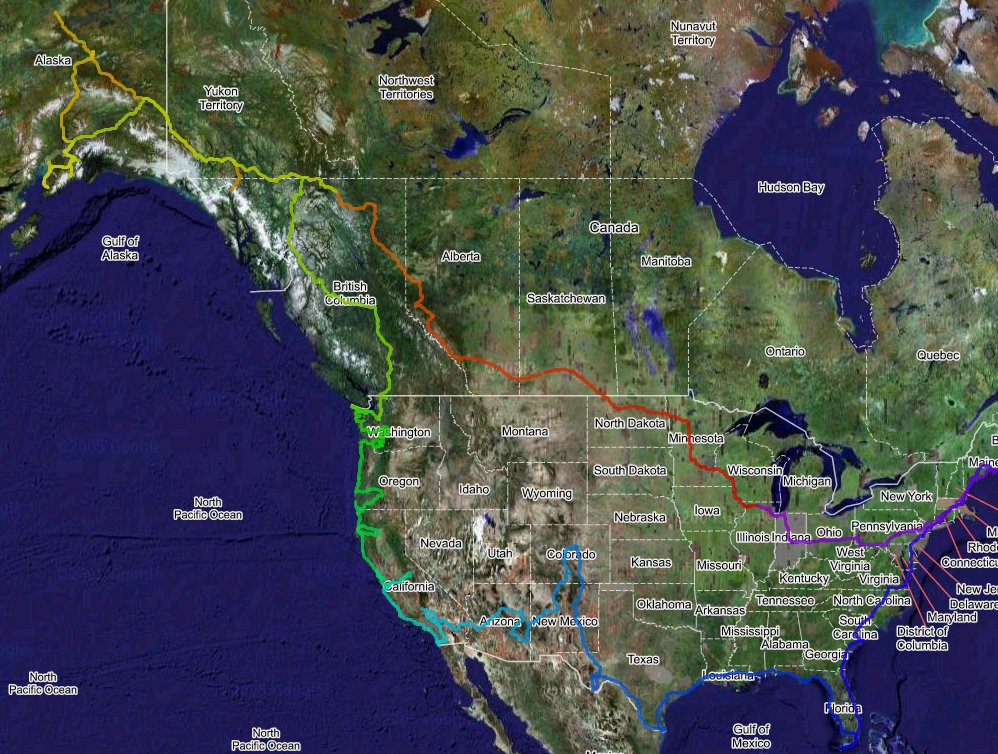
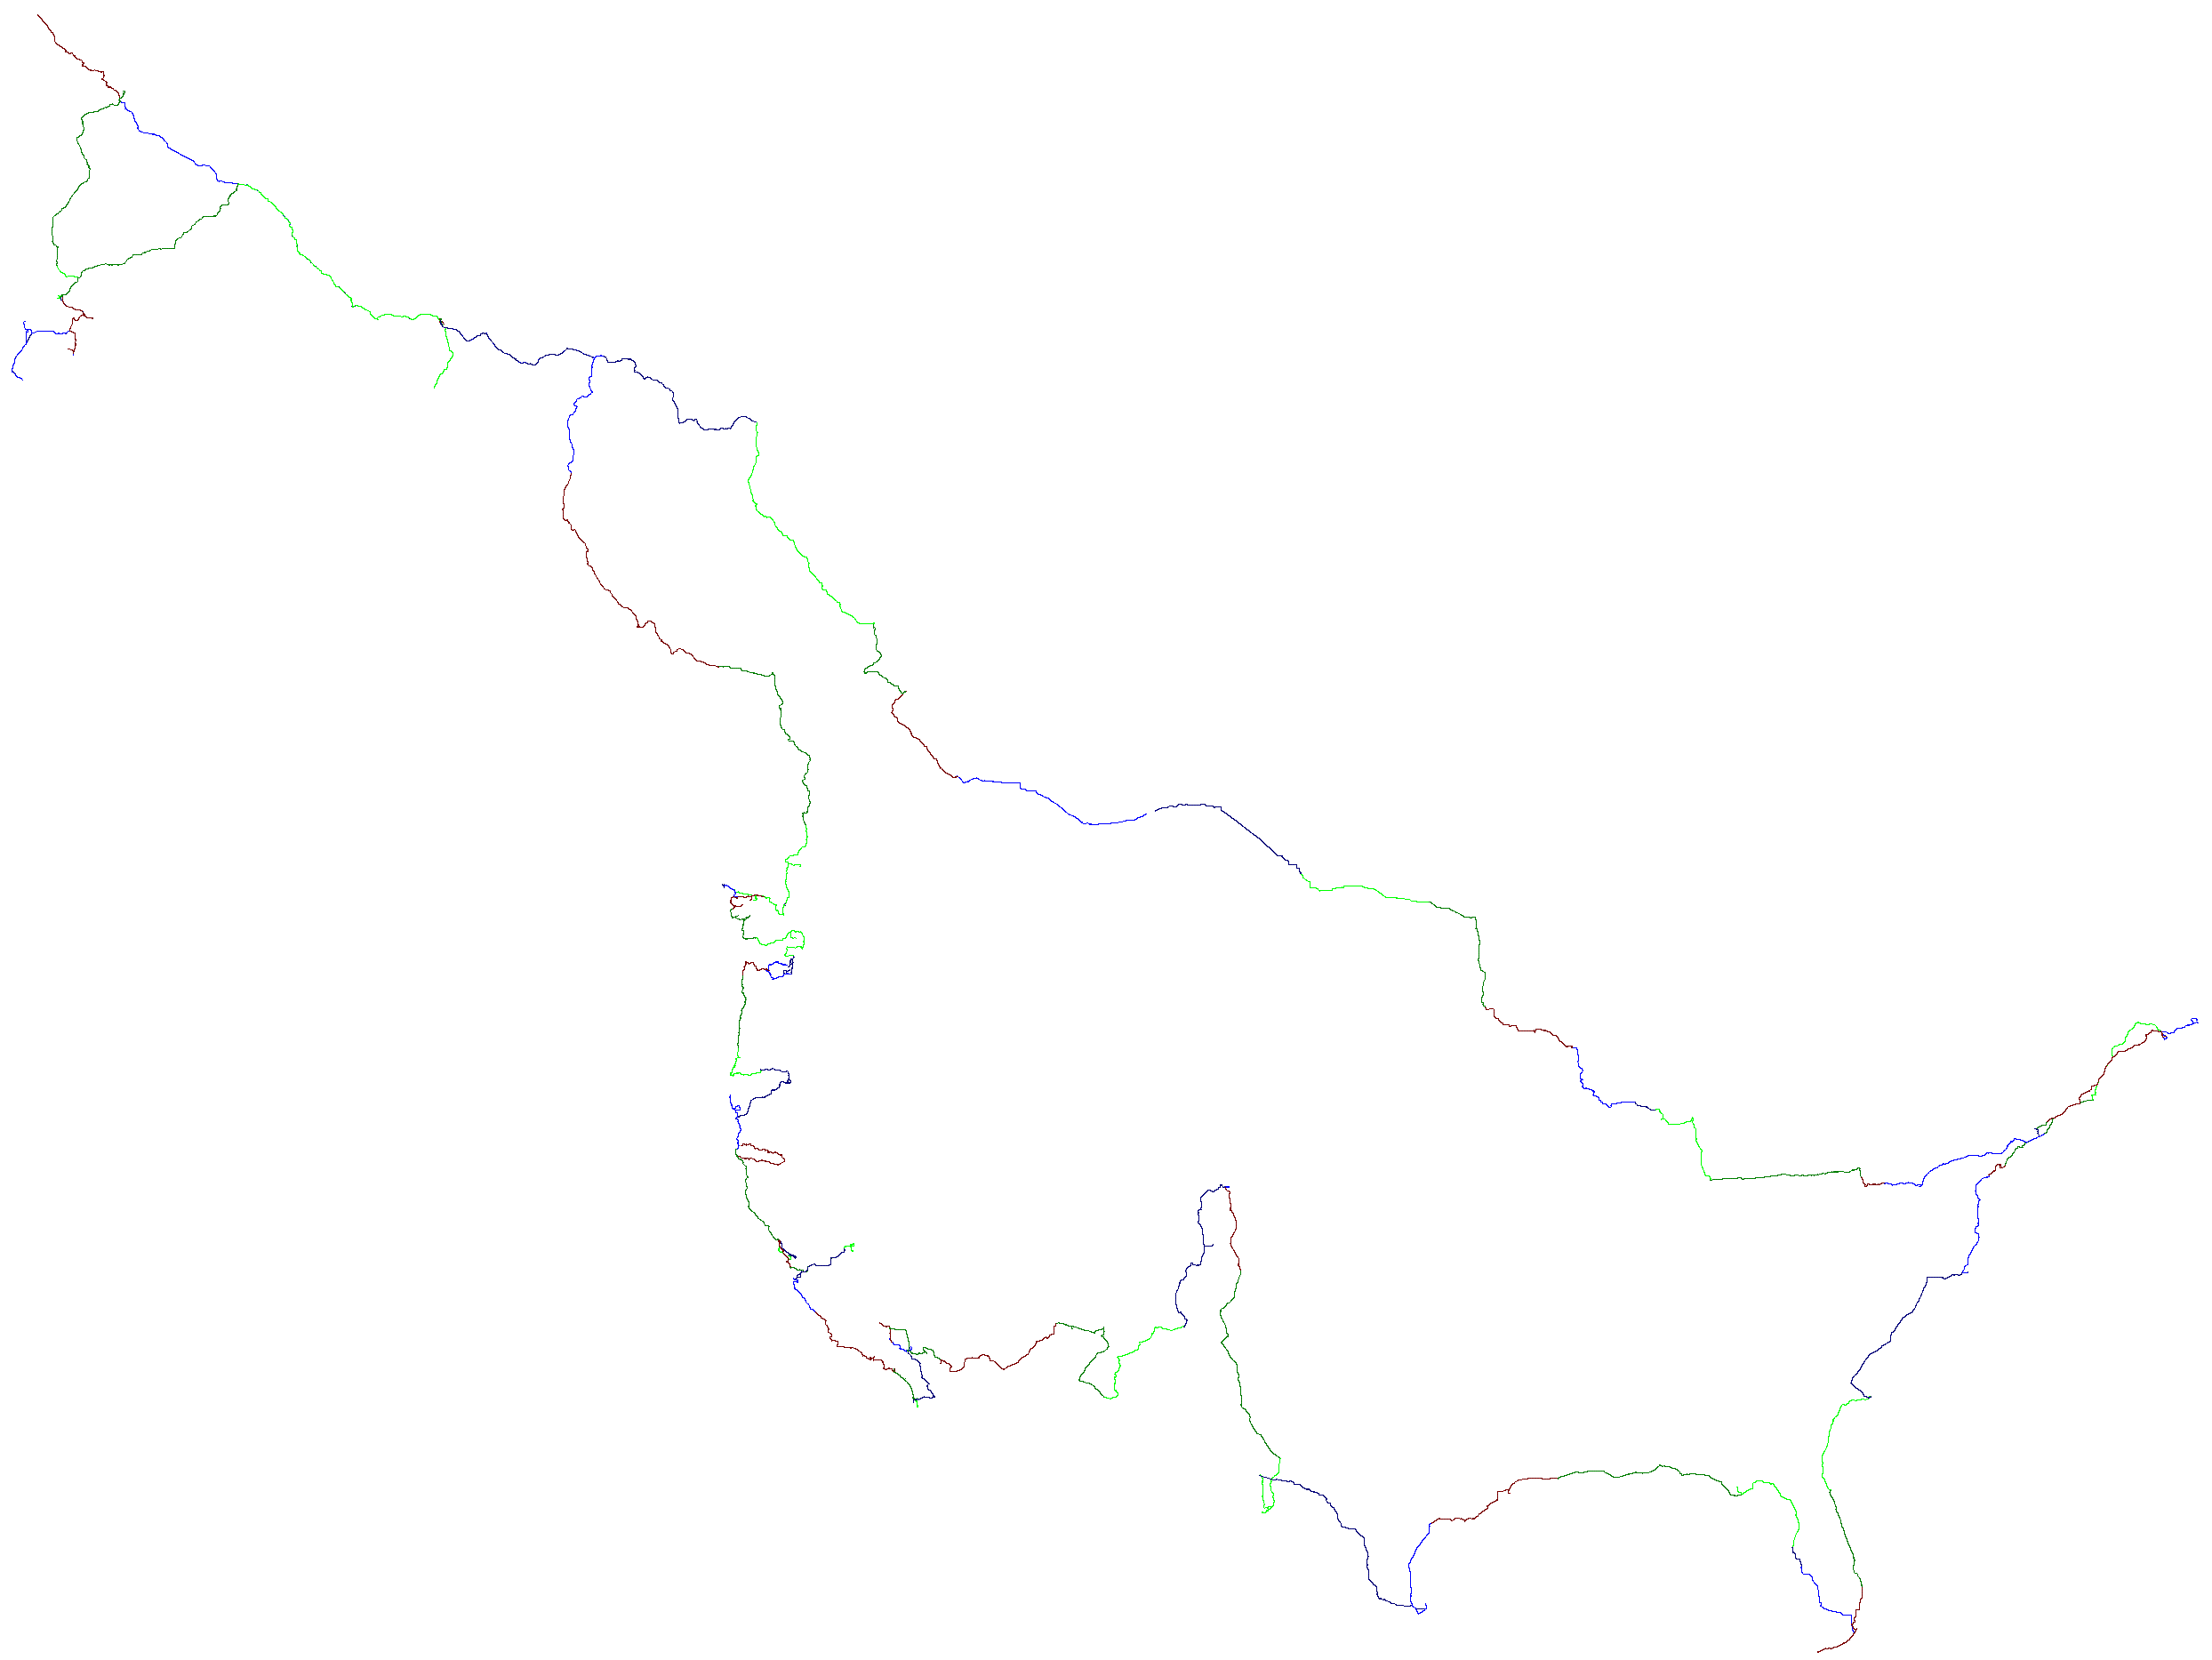
Google Maps
Somewhat the same as Google Earth but you shouldn't need to install
anything. You can zoom in/out and pan. I have two map options - one
with a "suggested" amount of data points and one with a "maximum"
number of data points. The larger sizes might take a couple minutes to
load -
try the smaller one first. |
|
click image for a larger size
|
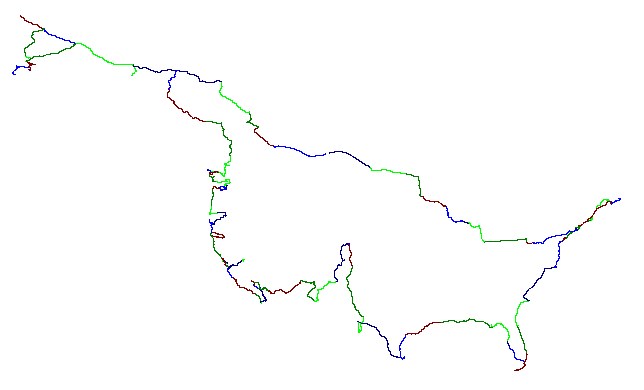
PNG's
Single color line graphic. Latitude /
Longitude gridlines. |
|
click image for a larger size - BIG - scroll around
|
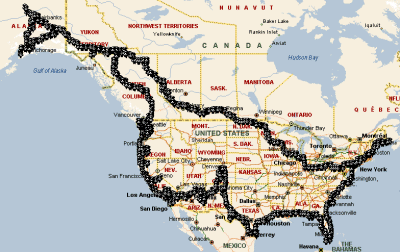
WayPoint+
Plot
A
multi-colored plot graphic of the track on a white background. Each
color is a day of riding. |
|
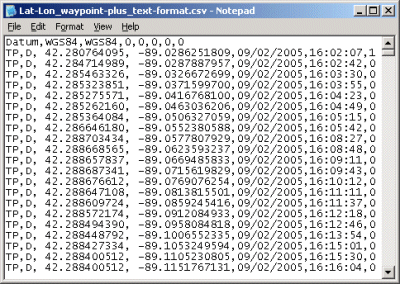 |
Source data
WayPoint+ format
Each track is separated from the next with the repeating header and a
"1" in the far right column.
Some of the days had invalid date and time stamps. I've changed the
invalid dates to valid dates but the invalid times are left as-is. It's
apparent as to which days were invalid as the times entries for a
particular day are the same. |
|
 |
Source
data, reduced
Lat-Lon
with track separations
ASCII text
(0.7 MB, zip)
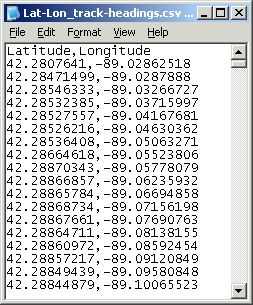
Basic
Latitude - Longitude, comma separated, one entry per line. One heading
before each track.
|
|
 |
Source
data, reduced
Lat-Lon
- bare
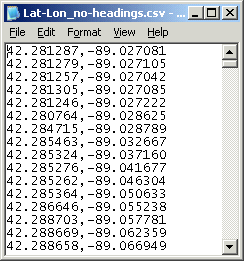
Basic
coordinates, comma separated, one entry per line.
As noted above, if you have a more current version of Street Atlas
(2005 perhaps) - you can import this bare Lat-Lon file as a track. |
|